Meeting date: September 5, 2018
Report no.: BH.01.SEP0518.R24
Prepared by: Jennifer MacLeod, Manager, Health Analytics
Approved by: Kyle Wilson, Director, Information Systems
Submitted by: Dr. Nicola J. Mercer, MD, MBA, MPH, FRCPC, Medical Officer of Health and CEO
Recommendations
It is recommended that the Board of Health:
- Receive this report for information.
Key Points
- Information gathered through population health monitoring can be used to identify key threats to wellness in a community. Factors that contribute to healthy and unhealthy communities can be identified.
- Wellington-Dufferin-Guelph Public Health (WDGPH) provides quality data, analysis, surveillance and evidence-informed practice to help local agencies make decisions about program planning, service delivery, resource allocation and policy development.
- The WDGPH Health Analytics Team has transitioned to sharing information using online interactive reports. These interactive reports will allow agencies to make targeted decisions. There are key advantages to sharing information in this new format.
- The information can be quickly updated as data sources are refreshed.
- This format allows for flexibility.
- The visualizations of the data support end users in identifying patterns and trends of interest.
- Interactive reports can be quickly and easily shared.
- Access to shared data results in increased opportunities for collaboration.
- The WDGPH interactive reports showcase local data used to build healthy communities, strengthen collaboration and support local health system planning.
Discussion
A provincial public health report, Mapping Wellness: Ontario’s Route to Healthier Communities,1 discusses the importance of monitoring the health of our community over time by collecting information to contribute to informed evidence-based decisions about how to invest in wellness. The report further explains that information gathered through population health monitoring can be used to identify key threats to wellness in a community. Neighbourhoods or populations that are at risk of poor health can be identified, as well as communities where people are thriving. Factors that contribute to healthy and unhealthy communities can be identified.
Local data is important because health issues vary from community to community.
- Mapping Wellness: Ontario’s Route to Healthier Communities, 2015
WDGPH practitioners and other community service providers and decision makers use data on a regular basis to better understand populations and to inform planning.
The WDGPH Health Analytics Team has, for many years, monitored and assessed the health of the local population and has provided pertinent information to community partners to support their work. Increasingly, with new requirements under the Ontario Public Health Standards and emerging health risks, it has become more pressing to gather large amounts of complex data and quickly synthesize it into meaningful information to share with partners.
The Health Analytics Team has transitioned to sharing information using online interactive reports. There are key advantages to sharing information in this new format:
- Up to Date
- The information can be quickly updated as data sources are refreshed. Paper reports often became outdated shortly after being printed. A recent example of this is the Statistics Canada census data. An interactive report was developed to share social determinants of health indicators by municipality. Months later we received custom neighbourhood data for the City of Guelph. Within one week the data model was expanded to include these new data and indicators were displayed by neighbourhood in the interactive report.
- Flexible
- This format allows for flexibility. Interactive reports can be customized by end users to meet their own specific needs simply by choosing filters of interest. Users might be interested in seeing the information in a particular geographic area or within a certain age group and be able to build a report that meets their needs in this way. In the past, requests for customized information were made to the Health Analytics Team. Responding to these requests meant diverting staffing resources from other work and partners had to wait to receive the information. This flexible end-user customization of reports will result in increased efficiency of departmental staff resources.
- Visual
- The visualizations of the data support end users in identifying patterns and trends of interest. The information is visualized in maps, charts and infographics. These formats enhance the ability to search for and identify specific information such as a trend across time (months or years) that is moving in a concerning direction. These trends will be used by community partners for evidence-based decision making and strategic planning.
- Accessible
- Interactive reports can be quickly and easily shared. Sharing can be customized so that interactive reports with sensitive information can be made available to specific groups of people for whom it’s intended. Most interactive reports are openly shared to the general public.
- Collaborative
- Access to shared data results in increased opportunities for collaboration.
A number of WDGPH interactive reports have been developed. The reports are in various formats:
- Community profiles
- Population profiles
- Health status reports
- Surveillance reports
- Tracking dashboards
- Health topic specific (i.e., Overdose and Drug Use Information System)
There are plans in place to develop more reports and to update the current reports as data cycles refresh. All of these reports will be pulled together as part of a larger community picture in order to make the information easily accessible for those that need it.
A community partner who has used the interactive reports provided some feedback about their value:
“The Interactive Reports give me access to data that will make our reporting to provincial and local governments more interesting and robust… they let me easily connect and compare population-level trends in our service area with what we see happening with [our clients]. I also think that the reports are a great tool for cross-agency collaboration, because we will all have access to the same baseline data to inform our work as we plan, analyze and act to support the most vulnerable people in our communities.”
Dashboards
Some of the interactive reports are in the form of tracking dashboards. These dashboards have been developed for internal programs and community initiatives in which WDGPH is a key partner:
- WDGPH Oral Health Team
- Community Health Van
- Harm Reduction supplies
One community partner shared their thoughts about the benefits of the dashboard:
“Before our dashboard the [program] was always a few steps behind in tracking our data. We were using valuable staff time to hand count tracking sheets, and fumbling around in excel to try and ensure accurate counts of products and clients. The dashboard incorporates my provincial reporting requirements, as well as common questions that are asked about the program, and developed the report around them. Now I have real-time tracking and am able to create reports in hours that used to take me days.”
There are plans in place to implement dashboards for WDGPH program areas to enhance their ability to quickly and easily track key components of their service delivery.
Evidence-informed planning
The interactive report format lends itself well to evidence-informed planning. Planning tables use these reports as hands-on tools for decision making. WDGPH has facilitated evidence-informed planning sessions using interactive reports with:
- The Dufferin sub-region collaborative of the CWLHIN
- A Wellington sub-region planning session for substance use outreach staffing
- The Headwaters Healthcare Corporation Board
A community partner shared her thoughts about the value of interactive reports in supporting planning:
“Making data-driven and evidence-informed decisions is critical to achieving outcomes for [our initiative] I am thankful to have the interactive reports developed by WDGPH to help advance this aspect of our work. These reports are such a valuable asset to any organization engaged in system planning, research, and policy analysis.”
Launch/awareness/training
WDGPH launched these interactive reports to community partners in late June. Three separate sessions were facilitated. A session for senior leaders included a brief discussion on the value of population health monitoring and a demonstration of the interactive reports. Two sessions for data users in the community provided more in-depth information about the interactive reports including a guided hands-on session. Participants were provided with written information describing how to navigate the interactive reports (see Appendix A).
At the end of the sessions participants were asked to provide feedback. Most participants (90%) who responded indicated that they would use the interactive reports in their work. Some examples they provided on how the reports would be used were:
- Planning for locations of future nursing clinics
- Initiate deeper conversations into how we might better serve our patient population, in particular identify the SDOH areas and how they can be addressed
- Building sub-region profiles
- To optimize funding and target community health initiatives with our partner organizations
- For identifying priority areas
- Resource allocation
- Program development, granting/funding decisions, support for emerging system change initiatives
Respondents also indicated that they found the interactive reports to be useful:
| Statement | % who agreed with each statement |
|---|---|
| The interactive reports are easy to navigate. | 100% |
| The interactive reports provide enough background information. | 100% |
| The information in the interactive reports is easy to interpret. | 100% |
| The information in the interactive reports is relevant to my work. | 85% |
Conclusion
Population health monitoring allows WDGPH to identify factors that contribute to healthy and unhealthy communities. WDGP provides quality data, analysis, surveillance and evidence-informed practice to help local agencies make decisions about program planning, service delivery, resource allocation and policy development. The WDGPH Health Analytics Team has transitioned to sharing information using online interactive reports. These interactive reports will allow agencies to make targeted decisions. There are key advantages to sharing information in this new format, which have been outlined throughout this report. The WDGPH interactive reports showcase local data used to build healthy communities, strengthen collaboration and support local health system planning.
Ontario Public Health Standard
“Population health assessment includes the measurement, monitoring, analysis, and interpretation of population health data and knowledge and intelligence about the health status of populations and subpopulations, including social determinants of health and health inequities. Population health assessment provides the information necessary to understand the health of populations through the collaborative development and ongoing maintenance of population health profiles, identification of challenges and opportunities, and monitoring of the health impacts of public health practice.
Population health assessment also includes a monitoring role, described as epidemiological surveillance. This is the systematic and ongoing collection, collation, and analysis of health-related information that is communicated in a timely manner to all who need to know, so that action can be taken. It contributes to effective public health program planning, delivery, and management. Dissemination of analyses may take the form of reports, advisories, healthy public policy recommendations, alerts or warnings.”2
The board of health shall:
- Conduct surveillance, including the ongoing collection, collation, analysis, and periodic reporting of population health information.
- Interpret and use surveillance data to communicate information on risks to relevant audiences.
- Assess current health status, health behaviours, preventive health practices, risk and protective factors, health care utilization relevant to public health, and demographic indicators.
- Use population health, social determinants of health, health inequities and other sources of information to assess the needs of the local population, including the identification of populations at risk of negative health outcomes, in order to determine those groups that would benefit most from public health programs and services (i.e., priority populations).
- Tailor public health programs and services to meet identified local population health needs, including those of priority populations.
- Provide population health information, including social determinants of health, health inequities, and other relevant sources to the public, community partners, and other health care providers.
The medical officer of health of a board of health shall formally engage with the chief executive officer from each LHIN within the geographic boundaries of the health unit on population health assessment, joint planning for health services, and population health initiatives.
WDGPH Strategic Direction(s)
✓ ✓: We will provide programs and services that integrate health equity principles to reduce or eliminate health differences between population groups.
✓ Organizational Capacity: We will improve our capacity to effectively deliver public health programs and services.
Service Centered Approach: We are committed to providing excellent service to anyone interacting with WDG Public Health.
✓ Building Healthy Communities: We will work with communities to support the health and well-being of everyone.
Health Equity
One of the requirements of Population Health Assessment is to “provide population health information, including determinants of health and health inequities to the public, community partners, and health care providers.”2
Planning and delivery that is evidence informed is more effective in addressing needs that are influenced by differences in the context of local communities. Need is established by assessing the distribution of social determinants of health. Population health outcomes are often influenced disproportionately by sub-populations who experience inequities. It is known that living with less, limits choice and impacts health.
Tailoring programs and services to meet the needs of priority populations, results in improvements of overall population health outcomes.
References
- Ontario. 2015 Annual Report of the Chief Medical Officer of Health of Ontario to the Legislative Assembly of Ontario. Mapping Wellness: Ontario’s Route to Healthier Communities [Internet]. 2018. [cited 2018 July 30] Available from: http://www.health.gov.on.ca/en/common/ministry/publications/reports/cmoh_15/docs/cmoh_15.pdf
- Ontario. Ministry of Health and Long-Term Care. Protecting and Promoting the Health of Ontarians. Ontario Public Health Standards: Requirements for Programs, Services, and Accountability [Internet]. 2018. [cited 2018 July 3] Available from: http://www.health.gov.on.ca/en/pro/programs/publichealth/oph_standards/docs/ophs_2018.pdf
Appendix A
Navigating WDGPH’s Interactive Reports
These reports were built to allow you to explore data and discover trends with ease, you can find the interactive reports on our website www.wdgpublichealth.ca/data. Please refer to the instructions below and have fun exploring the reports!
Landing Page and Page Headers
Landing Page
- The landing page includes the available interactive reports, along with a summary of each report. Clicking on the report title highlighted in blue will take you to that report. Reports can also be accessed via the dropdown menu “Interactive Reports” at the top of the page.
Page Headers
- Each report page includes a heading at the top of the page to indicate the contents of the page much like you would find in a report.
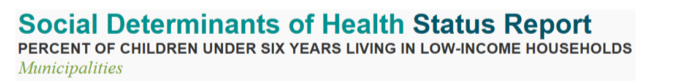
- In the report shown above, we can expect to find municipal-level data on the indicator: Percent of Children under Six Years Living in Low-Income Households.
Home Page
Every report home page includes a description of what you’ll find or learn within the report and buttons that will allow you to navigate through the report (as shown below).

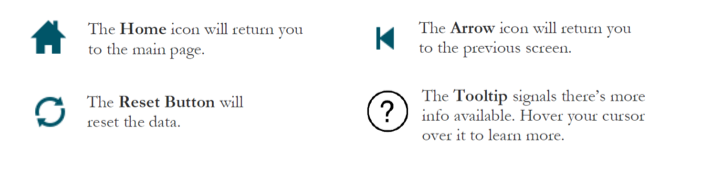
Action Buttons
There are a number of actionable items built into the reports that allow you quick navigation and personalization for the reports.
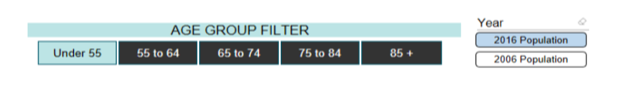
Filters
- Filters allow us to select subsets or groupings of the data that may interest us.
- If you click on a button within a slicer it will be highlighted. if you click on the button again it will be deselected.
Navigation Buttons
There are a number of actionable items built into the reports to allow you quick navigation and personalization of the reports.
Tables and Charts
- Most of our reports include a regional map such as the one below.
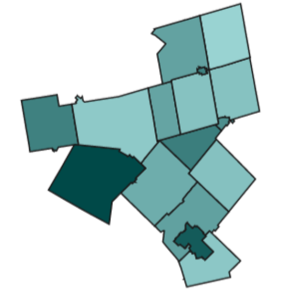
- Each municipality is shaded a hue to indicate the order of data values with darker shades as higher values
- Hover your cursor over a municipality to see the municipality name, as well as any data associated with that municipality.
- Click on a municipality to filter data by that municipality. Hold down the CTRL button while clicking on municipalities to select multiple municipalities.
- Each map includes a title to show what data is included in the map (e.g., Population Distribution (%) by Sub-Region, 2015).
- Most maps include a legend showing where municipalities stand in relation to other municipalities.
Other Visuals
- We do use other visuals to show data as line graphs and bar charts
- The type of visual used depends on the data. Maps are very useful for showing geographic patterns or differences
Printing Instructions
- To print a page, right-click and select print, or can click on the three dts at the top right of the screen and select print.
Navigating Pages within a Report
- There is a tool at the bottom of the page that allows one to scroll pages. It shows the number of pages, as well as current page (# of #). Click on the arrow to advance to the next or previous page. Click on “# of #” to go directly to a particular page.