Meeting Date: February 6, 2019
Report No.: BH.01.FEB0619.R04
Prepared By: Blair Hodgson, Health Promotion Specialist, Health Analytics; Jennifer MacLeod, Manager, Health Analytics
Approved By: Dr. Kyle Wilson, MSc, PhD, Director Information Systems & Chief Privacy Officer
Submitted By and Signature: Dr. Nicola J. Mercer, MD, MBA, MPH, FRCPC Medical Officer of Health & CEO
Recommendations
It is recommended that the Board of Health:
- Receive this report for information.
Key Points
- The Wellington-Dufferin-Guelph (WDG) Youth Survey collects self-reported health and well-being information from grade 7 and grade 10 students.
- The first Youth Survey was conducted in 2011-12 then again in 2014-15 and 2017-18.
- The 2017-18 Youth Survey had the highest response rate of all three (3) surveys.
- Analysis of the 2017-18 Youth Survey revealed trends related to substance use, mental health, physical activity and many other topics.
- Results have been shared, via individual school profiles, an online data portal and data requests.
- Upcoming knowledge translation activities include presentations to community planning tables and the release of population specific reports (i.e. a report on LGBTQ youth)
Discussion
Background
The WDG Youth Survey is a local health and well-being survey that collects self-reported information from grade 7 and 10 students. Students answer questions on a range of topics, including:
- Community and school environments;
- Family and peer relationships;
- Physical, mental and sexual health; and
- Substance use.
The Youth Survey is conducted every three (3) years. This means that students who complete the survey when they are in grade 7 will be asked to complete the survey again as grade 10 students. These grades were selected to address gaps in locally available data regarding the health and wellbeing of adolescents.
The goal of the Youth Survey is to create a shared understanding of students’ health and development. The survey helps service providers gain valuable insight into the well-being and behaviors of local youth. The knowledge gained from the survey is used to identify issues to focus on at the school, board and community level.
The survey is conducted by Wellington-Dufferin-Guelph Public Health (WDGPH) in partnership with the WDG Coalition for Report Cards on the Well-Being of Children (Report Card Coalition), the Upper Grand District School Board, the Wellington Catholic District School Board and the Dufferin Peel Catholic District School Board.
The Report Card Coalition
The Report Card Coalition is a local partnership of community service providers who are committed to raising the profile of children and youth. The Report Card Coalition provides access to a wide range of indicators that support an understanding of the health and well-being of children and youth in our community. Initially, data was shared in the form of static reports. However, in 2017, the coalition launched a new website which included a data portal. Information on the portal is updated regularly in order to provide stakeholders with timely information.
The 2017-18 Youth Survey
The Youth Survey was first conducted in 2011-12 and again in 2014-15. Data collection for the third iteration of the Youth Survey took place during of the 2017-18 school year.
The 2017-18 version of the Youth Survey included several new questions. These questions address bullying, daily video game use, e-cigarettes, cannabis, use of cough or cold medicine to get high, sending sexual photos or messages (“sexting”) and experiences of unwanted sexual activity. The 2017-18 Youth Survey also piloted a survey for grade 4 students within the Dufferin Peel Catholic District School Board. The 2017-18 Youth Survey was completed by more than 5300 students across the three (3) school boards. It had the highest response rate of the three (3) iterations, see Table 1.
Table 1. Youth Survey Response Rate by Grade.
Results Highlights
Below are key highlights from the 2017-18 Youth Survey. For more information on these and other findings, please visit www.wdgreportcard.com.
Substance Use
- The proportion of students who reported binge drinking in the last year decreased by 20% between 2014-15 and 2017-18.
- Cannabis use in the last twelve (12) months did not change between surveys. Grade 10 students were much more likely to report past year cannabis use (23%) than Grade 7 students (1%).
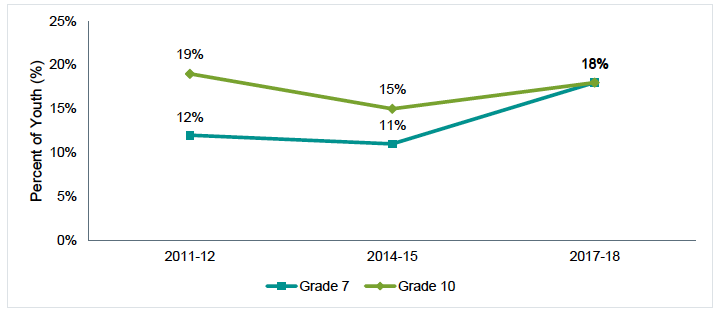
- The percentage of students who reported using prescription pain pills without a prescription in the last year increased between 2014-15 and 2017-18, especially for grade 7 students. (See Table 2)
Table 2. Use of Prescription Pain Pills without a Prescription in the Past Year, by Grade.
Mental Health
- Grade 7 males were most likely to report having high self-esteem (74%); grade 10 students who identified as non-binary were least likely to report high self-esteem (31%).
- 11% of students were at-risk of depression. Non-binary (36%) and female (15%) students were more likely to be at-risk than male students (6%).
- 9% of grade 7 students and 13% of grade 10 students reported thoughts of suicide in the past year.
Sedentary Behavior & Physical Activity
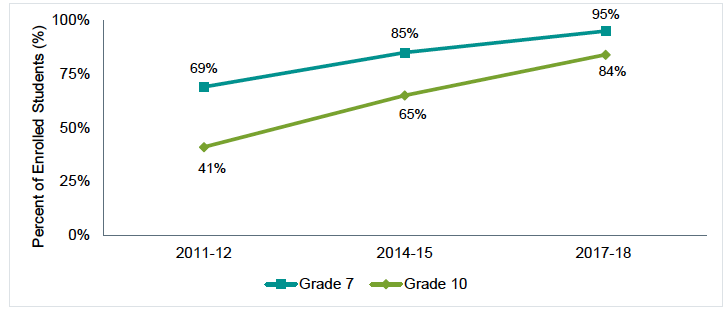
- Screen time outside of school has increased for all grades and genders. Since 2011-12 the percentage of students who reported more than two (2) hours of screen time a day has increased by 40% (See Table 3).
Table 3. Youth who Report More Than 2 Hours of Screen Time per Day, by Grade.
- 25% of students report meeting the Canadian 24-Hour Movement Guidelines for physical activity (at least 60 minutes per day).1
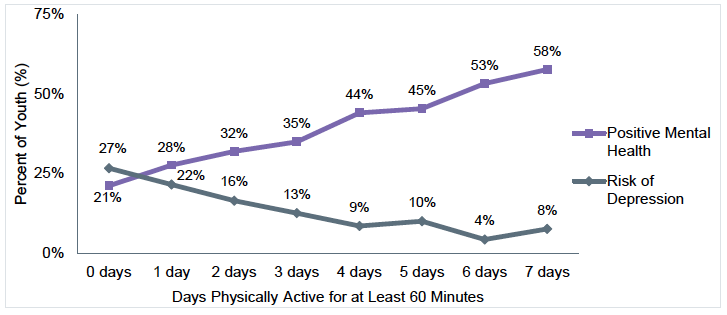
- The number of days students reported being physically active was strongly associated with mental health outcomes (see Table 3).
Table 4. Positive Mental Health and Risk of Depression by Days of Physical Activity.
Issues to Focus on in WDG
During the fall of 2018, the results of the 2017-18 Youth Survey were used to identify issues to focus on in WDG. These findings represented areas where some groups were struggling more than others or where concerning trends have emerged.
- Binge drinking has decreased but, prescription painkiller misuse increased and is starting younger.
- One in eight grade 10 girls reported experiencing unwanted sexual activity.
- Screen time has increased steadily over the past 6 years.
- Grade 10 girls are facing substantial mental health challenges.
- Non-binary youth, who do not identify as male or female, have the poorest outcomes across the board.
More details on these findings can be found in Appendix “A”.
Knowledge Translation
Information from the 2017-18 Youth Survey will be shared with schools, community partners and the public in several ways.
School Profiles
School and board specific results were shared with principals and administrators in the form of School Profiles. These paper reports contain information on demographics, school culture, challenges facing students and protective factors. The profiles also contain information on how to mobilize on key issues. In the spring of 2018, 82 School Profiles and 5 School Board profiles were shared. Each school board also received a presentation featuring key highlights.
The Report Card Coalition Data Portal
Data from the 2017-18 Youth Survey has been posted to the Report Card Coalition’s Data Portal at www.wdgreportcard.com. The Data Portal contains information from various data sources, including 28 measures from the Youth Survey. Information on the data portal is available by grade, gender, municipality and Guelph neighbourhood.
Population Specific Reports
WDGPH and the Report Card Coalition plan to release short reports which focus on populations who may experience unique challenges. The first reports will examine LGBTQ students and students who identify as visible minorities. Populations and/or topics for subsequent reports will be determined based on stakeholder requests and community interest.
Presentations to Planning Tables
2017-18 Youth Survey results will also be shared with local planning tables and community partnerships through presentations. Key findings and opportunities for action will be shared with Growing Great Generations, a system-level planning table for children and families in Guelph and Wellington, and other stakeholders. The Report Card Coordinator regularly works with partners to identify opportunities for knowledge translation presentations.
Data Requests
The Report Card Coordinator is also responsible for fulfilling requests for Youth Survey data. To date, data has been shared with several program areas as well as external partners. Recently, information on students from Wellington North related to prescription drug use without a prescription was shared to inform a Town Hall discussion in Wellington North. Information on mental health indicators was used to inform a service planning discussion in the Wellington LHIN sub-region.
Conclusion
The Youth Survey collects valuable self-reported health and well-being data from youth in WDG. The results of the survey help create a shared understanding of student’s health and identify challenges facing local youth. The third cycle of the Youth Survey was collected during the 2017-18 school year.
Analysis of the 2017-18 Youth Survey revealed trends related to substance use, mental health, physical activity and many other topics. Results have already been shared through School Profiles, the Report Card Coalition Data Portal and data requests. Presentations to community planning tables and population specific reports will be completed in 2019.
Ontario Public Health Standard
The 2017-18 Youth Survey is relevant to the Population Health Assessment component of the Foundational Standard.
Population Health Assessment
“Population health assessment includes the measurement, monitoring, analysis, and interpretation of population health data and knowledge and intelligence about the health status of populations and subpopulations, including social determinants of health and health inequities. Population health assessment provides the information necessary to understand the health of populations through the collaborative development and ongoing maintenance of population health profiles, identification of challenges and opportunities, and monitoring of the health impacts of public health practice”.2
WDGPH Strategic Direction(s)
✓ Health Equity: We will provide programs and services that integrate health equity principles to reduce or eliminate health differences between population groups.
Organizational Capacity: We will improve our capacity to effectively deliver public health programs and services.
Service Centred Approach: We are committed to providing excellent service to anyone interacting with WDG Public Health.
✓ Building Healthy Communities: We will work with communities to support the health and well-being of everyone.
Health Equity
Youth Survey results are used to identify issues to focus on at the school, board and community level. However, youth in WDG are not a homogeneous group. As standard practice, Youth Survey results are examined by geography, grade and gender. This allows service providers to identify groups who may be struggling more than others in certain areas. For example, non-binary and female students in grade 10 consistently report poorer mental health outcomes than male and grade 7 students.
The population specific reports will share detailed information on identified groups. The goal of the reports is to improve our understanding of these populations and raise awareness of specific challenges that these youth may be facing.
References
Canadian Society for Exercise Physiology. 24-Hour Movement Guidelines for Children and Youth [Internet]. 2016. [cited 2018 October 29] Available from: http://www.csep.ca/view.asp?x=696
Ontario Ministry of Health and Long-Term Care. Protecting and Promoting the Health of Ontarians. Ontario Public Health Standards: Requirements for Programs, Services, and Accountability [Internet]. 2018. [cited 2018 October 29] Available from: http://www.health.gov.on.ca/en/pro/programs/publichealth/oph_standards/docs/ophs_2018.pdf
Appendices
Issues to Focus on in WDG
Text Summary of Graphic
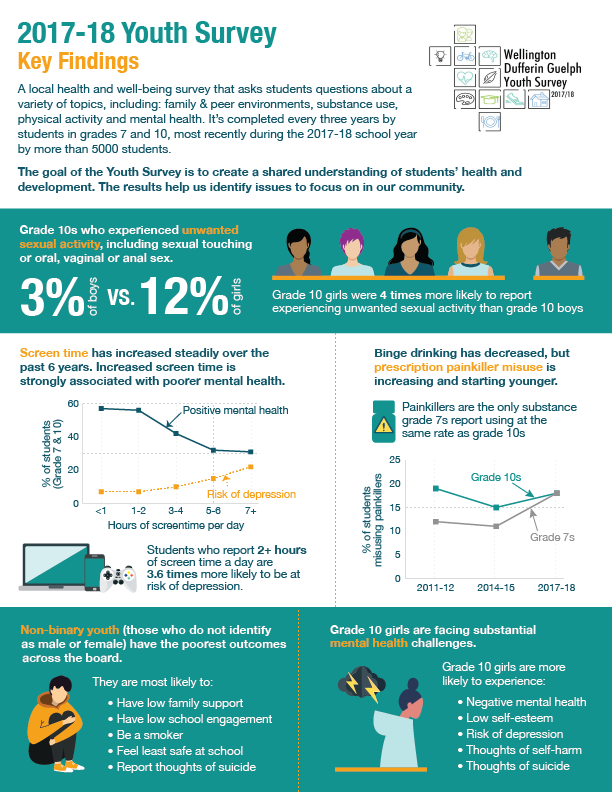
2017-18 Youth Survey: Key Findings
A local health and well-being survey that asks students questions about a variety of topics including: (i) family & peer environments; (ii) substance use; (iii) physical activity; and (iv) mental health. It’s completed every three (3) years by students in grades 7 and 10, and, most recently during the 2017-18 school year by more than 5000 students.
The goal of the Youth Survey is to create a shared understanding of students’ health and development. The results help us identify issues to focus on in our community.
- Among grade 10 students, 3% of boys and 12% of girls experienced unwanted sexual activity including: (i) sexual touching; or (ii) oral, vaginal or anal sex.
- Grade 10 girls were 4 times more likely to report experiencing unwanted sexual activity than grade 10 boys.
- Screen time has increased steadily over the past 6 years.
- Increased screen time is strongly associated with poorer mental health.
- Students who report 2+ hours of screen time a day are 3.6 times more likely to be at risk of depression.
|
Hours of Screen Time per Day |
Percent of Students with Positive Mental Health |
Percent of Students at Risk of Depression |
|---|---|---|
|
Less than 1 hour a day |
57% |
7% |
|
1 or 2 hours a day |
56% |
7% |
|
3 or 4 hours a day |
42% |
10% |
|
5 or 6 hours a day |
32% |
15% |
|
7 or more hours a day |
31% |
22% |
- Binge drinking has decreased but prescription painkiller misuse is increasing and starting younger.
- Painkillers are the only substance grade 7 students report using at the same rate as grade 10 students.
|
Percent of Students Misusing Painkillers |
|||
|---|---|---|---|
|
|
2011-12 |
2014-15 |
2017-18 |
|
Grade 7s |
12% |
11% |
18% |
|
Grade 10s |
19% |
15% |
18% |
- Non-binary youth (those who do not identify as male or female) have the poorest outcomes.
- They are most likely to:
- Have low family support;
- Have low school engagement;
- Be a smoker;
- Feel least safe at school; and
- Report thoughts of suicide.
- They are most likely to:
- Grade 10 girls are facing substantial mental health challenges.
- Grade 10 girls are more likely to experience:
- Negative mental health;
- Low self-esteem;
- Risk of depression;
- Thoughts of self-harm; and
- Thoughts of suicide.
- Grade 10 girls are more likely to experience: