Meeting Date: March 6, 2019
Report No.: BH.01.MAR0619.R09
Prepared By: Amanda Scales, Health Promotion Specialist, Healthy Communities and Public Policy; Amy Estill, Manager, Healthy Communities and Public Policy
Approved By: Andrea Roberts, Director, Family Health
Submitted By & Signature: Dr. Nicola J. Mercer, MD, MBA, MPH, FRCPC Medical Officer of Health & CEO
Recommendations
It is recommended that the Board of Health:
- Receive this report for information.
Key Points
- Wellington-Dufferin-Guelph Public Health (WDGPH) worked with four (4) local municipalities (Centre Wellington, Orangeville, Guelph, and Shelburne) to collect measures (indicators) for how well the built environment in each community supports health.
- The built environment refers to the human-made or modified physical surroundings in which people live, work, and play.1
- A survey was used to collect resident opinions about the design of their neighbourhoods and to examine how they travel (e.g. by car, walking, biking etc.) within their neighbourhood.
- Data was collected from other sources to measure physical components of the community related to neighbourhood design, transportation networks, natural environments, and food systems.
- Findings identified strengths in each community’s design and opportunities to work together to enhance elements of the built environment.
- The project will be repeated in five (5), ten (10), and fifteen (15) years to monitor and evaluate changes in the built environment.
Discussion
“Public health officials need to view the built environment as having as much influence on public health as vaccines.2”
- Richard Jackson, MD, MPH, former director of the Centers for Disease Control and Prevention’s National Center for Environmental Health
Background
A community’s built environment is the human-made or modified physical surroundings in which people live, work, and play.1 The built environment of a community greatly impacts the health of its people by influencing behaviours or creating conditions that contribute to health or disease.3 For example, designing communities that provide safe walking and cycling routes, parks and green spaces, and access to healthy food sources, will encourage physical activity, reduce air pollutants caused by vehicle use, and promote good nutrition, all of which contribute to positive health.1,3 Furthermore, communities that are designed to support active living result in economic cost-savings including reductions in health care expenses for illnesses and diseases related to physical inactivity.1
In many communities there is a lack of data measuring how well the built environment supports health. To address this information gap and gather evidence on various healthy community design (HCD) features in local communities, WDGPH partnered with four (4) local municipalities to conduct the Baseline Indicators Project (hereinafter referred to as “Baseline Project”).
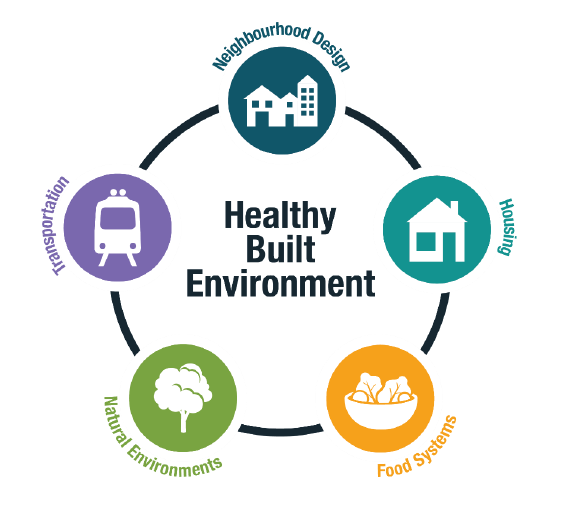
A Framework for Healthy Built Environment developed by the BC Centre for Disease Control (Figure 1), identifies important elements and principles of a healthy built environment and describes the links between design features, planning and health.4
The Baseline Project measured four (4) of the five (5) feature areas from this framework: neighbourhood design, transportation networks, natural environments, and food systems.
The objectives of the Baseline Project were:
- to determine residents’ preferences related to community design and determine how residents travel within their current neighbourhood;
- to gain an understanding of residents’ knowledge of the relationship between community design and health; and
- to collaborate with municipal planning departments to collect community-specific measures of physical built design elements.
The Baseline Project created a tailored baseline measure of HCD indicators for four (4) local communities using two (2) main methods:
- Survey. A survey was used to collect resident opinions and knowledge about the link between community design and health. The survey also asked residents about their active-travel behaviours (i.e. walking, biking, and rolling).
- Physical form data. Existing data about the physical features of the community was collected, analyzed, and mapped (where appropriate) to describe the actual design of the community.
Figure 1. A Framework for Healthy Built Environment.4
The outcomes of the Baseline Project will be used by WDGPH and municipalities to inform community planning, healthy public policy, and interventions related to HCD.
Methods:
WDGPH partnered with the planning departments at the Township of Centre Wellington, the Town of Orangeville, and the City of Guelph to conduct the Baseline Project. Additionally, through partnership with the Economic Development Committee at the Town of Shelburne, an adapted version of the Baseline Project that only included the Neighbourhood Design Survey (NDS) was conducted. The Shelburne survey also included questions about residents’ and business owners’ opinions of and preferences for downtown Shelburne, to inform the town’s Community Improvement Plan.
Neighbourhood Design Survey
The NDS was conducted from October 10th to December 15th, 2017 (exception: Shelburne data collection was May 14th to July 2nd 2018). A total of 4,104 residents voluntarily completed the NDS, plus 30 additional business owners for the Shelburne project (Table 1).
| Municipality | Number of respondents |
|---|---|
|
Centre Wellington |
568 |
|
Orangeville |
725 |
|
Guelph |
2,478 |
|
Shelburne |
333 (plus 30 business owners) |
People who completed the survey differed in age, gender, and education from the general population of each community. To compensate for this, statistical weighting techniques were used to adjust the survey results to reflect the demographics of each community’s residents as measured by Statistics Canada 2016 Census data.
Additionally, in consultation with each municipality, each community was divided into separate study areas for more granular analysis. Statistical significance testing was conducted to identify differences in resident perceptions across the study areas.
Physical form indicators
WDGPH worked with each municipality to compile a list of indicators to measure the built environment of each community. The total number of indicators measured differed for each municipality based on local data availability and municipal priorities or interest. All chosen measures fit within one of the four (4) feature areas of the Framework for Healthy Built Environment. For example:
- dwelling density and intersection density were used to measure features of neighbourhood design
- percentage of dwellings within 800 metres of a supermarket and total kilometres per hectare of local trails were used to measure aspects of transportation networks,
- total hectares of park/greenspace was used to measure natural environments
- a modified retail food environment index was used to measure food systems
These indicators were collected and mapped for each municipality. The physical form indicators, in combination with the resident perception data from the survey, contributed towards an understanding of the complexity of the built environment in each community.
Results
Data from the NDS and physical form indicator maps were compiled for each community to identify trends, areas of strength, and opportunities for action. Collaborative discussions between WDGPH and municipal planning staff occurred to formulate recommendations, identify additional data to be monitored or strengthened, and detect priority areas for interventions or partnership projects.
A report of all findings and recommendations will be provided to each municipality. Appendices of all data tables, raw variable data, and a technical appendix outlining the methodology and sources of data will also be provided. Additionally, WDGPH will design interactive dashboards to present project data on a virtual platform that will provide municipalities with an easy way to view and manipulate their data.
While complete reports for each municipality are still being finalized, this Board of Health report highlights some examples of positive healthy community design findings. Opportunities for improvement will also be highlighted for each municipality in their complete report.
Centre Wellington
Figure 2 illustrates population change for Centre Wellington from 2011-2016. During this five-year span, the population of Centre Wellington grew 7%. Fergus experienced a growth of 6% and Elora/Salem experienced a growth of 9%. As the map illustrates, most of the population growth occurred outside of the main urban centres.
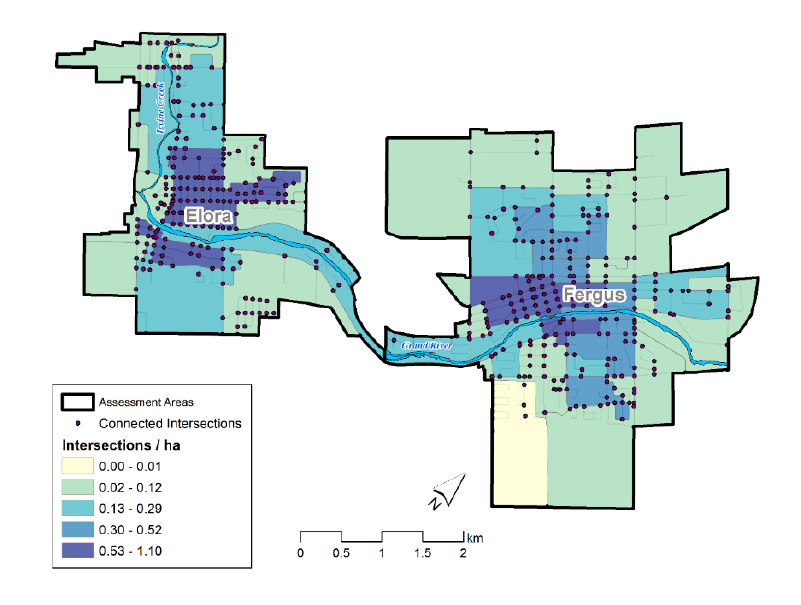
When considered alongside intersection density (Figure 3), an indicator used to describe street connectivity, it became clear that the areas with the fastest growing populations were not the most connected areas. Neighbourhoods with street and sidewalk connectivity that link residential, commercial, and recreational locations, encourage residents to travel actively, reduce vehicle use, increase social interactions, and contribute to feelings of safety.4 Interestingly, the NDS discovered that 76% of Centre Wellington residents agreed with these benefits of a connected neighbourhood design.
Making connections among these indicators (and others) revealed an opportunity for promoting neighbourhood connectivity in the growing areas of Centre Wellington. One recommendation was to add WDGPH to circulation lists to review and comment on healthy community design principles, such as connectivity, for related policy and land-use development applications.
Figure 2. Map of population change indicators for Centre Wellington.
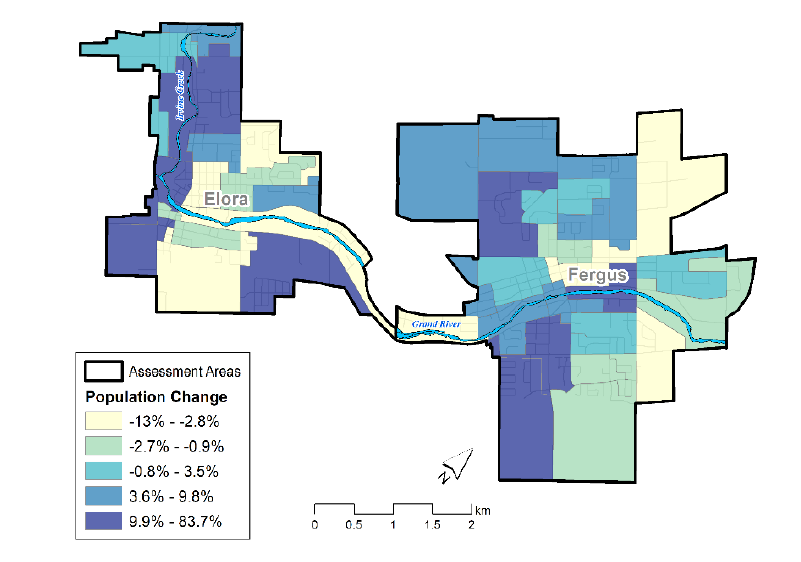
Figure 3. Map of intersection density indicators for Centre Wellington.
Orangeville
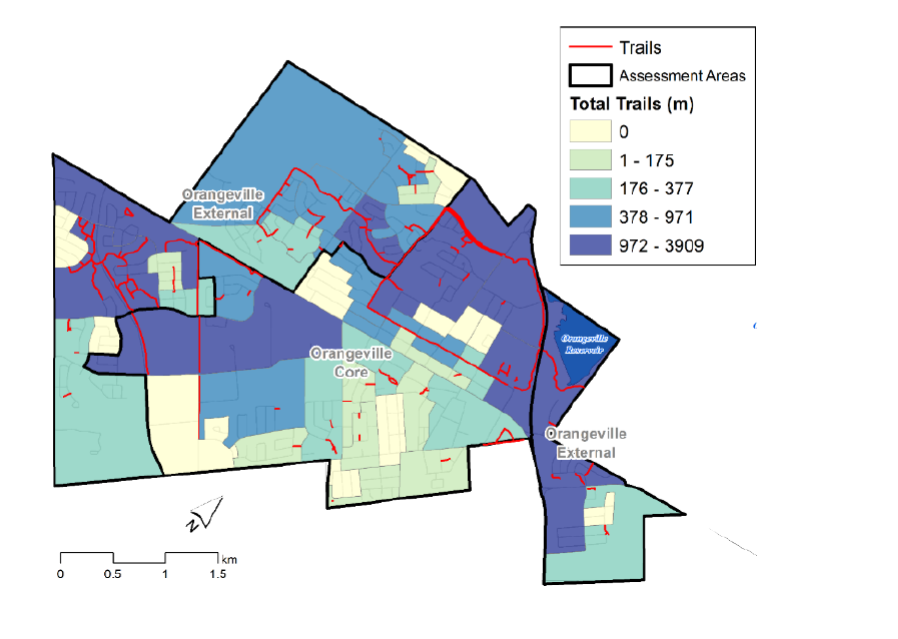
In Orangeville, the proximity of residential dwellings to parks or greenspace and the significant trail networks throughout the area were identified as strengths. Access to nearby parks and open greenspace contributes to physical, mental, and overall well-being by creating opportunities for residents of all ages and abilities to be physically active and engage with the natural environment.1,3,4 Mapping revealed that over 93% of dwellings were within 800 metres, approximately a ten (10) minute walk, of a park or greenspace (Figure 4). In addition, Figure 5 illustrates the extensive trail coverage in the external areas and extending into the central urban core of Orangeville. This trail network connects the community and encourages people to walk, bike, or roll for recreation and transportation. These findings may help explain why survey findings indicated that more residents from the external areas of town felt they could actively travel (i.e. walk, bike, or roll) and reported actively travelling more than residents living in the downtown core.
Making connections among these baseline indicators in Orangeville identified the importance of sharing the data with other community stakeholders. For example, committees working on parks, recreation, and trails-related policy plans could benefit from using this baseline data to support future funding and efforts towards formalization, maintenance, and development of the trail systems.
Figure 4. Map illustrating percentage of dwellings within 800m of a park in Orangeville.
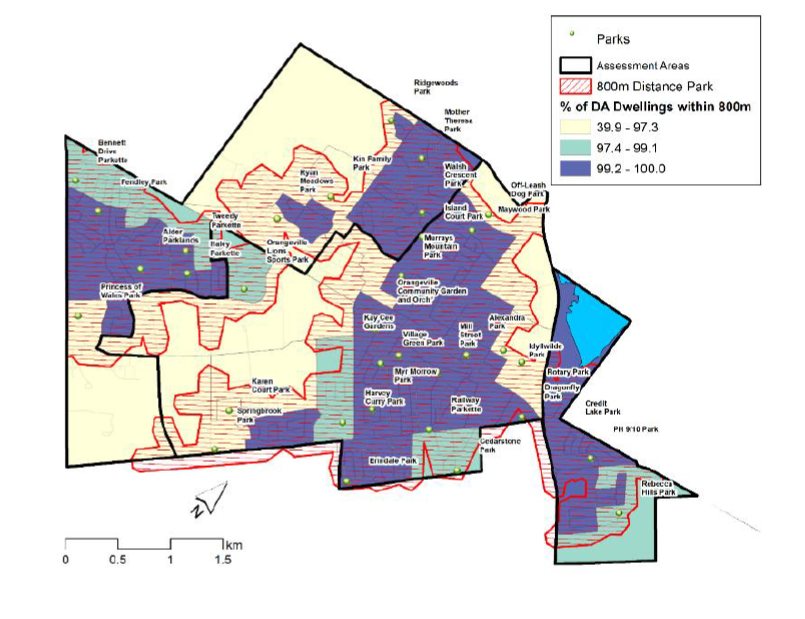
Figure 5. Map of trail network indicators in Orangeville.
Guelph
The Baseline Project identified transportation networks as an asset for the City of Guelph. According to the NDS, the majority of Guelph residents felt that they could walk, bike, or roll to many locations within their neighbourhood. In these cases where residents felt they could get to destinations using active transportation, residents also reported that they did walk, bike, or roll to many of those locations.
Specifically, 66% of Guelph residents indicated that it was important to them to be able to travel actively to outdoor recreation destinations such as a park/greenspace, a trail, and for exercise. As is illustrated in Figure 6, over 87% of residential dwellings in Guelph were within 800 metres (approximately a ten-minute walk) of a park or greenspace.
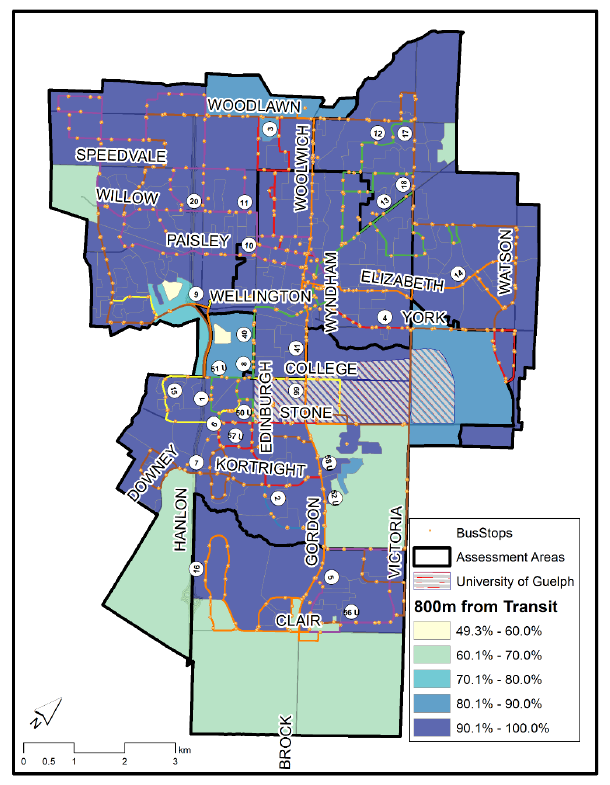
In addition to walking, biking, and rolling, public transit (e.g. buses) supports active transportation within a community and provides both health and environmental benefits. Communities that have sidewalks, bicycle lanes, and direct connections of neighborhoods to transit routes make transit more accessible.4 These design elements enable all residents to move around their neighbourhoods, feel connected, and access amenities and services within the community.4 Access to bus transit was significant in Guelph with transit routes extending across the majority of the city and 96% of all residential dwellings being located within 800 metres of a bus stop (Figure 7).
One recommendation that emerged from considering these baseline indicators was to promote planning and development that further enhances connectivity and encourages active transportation across the entire city. Design elements that could be used to meet this recommendation are continuous and connected sidewalks, trails, bicycle lanes, and direct connections to transit.
Figure 6. Map of proportion of dwellings within each Guelph study area that were within 800m (approx. 10 min. walk) distance to a park or greenspace.
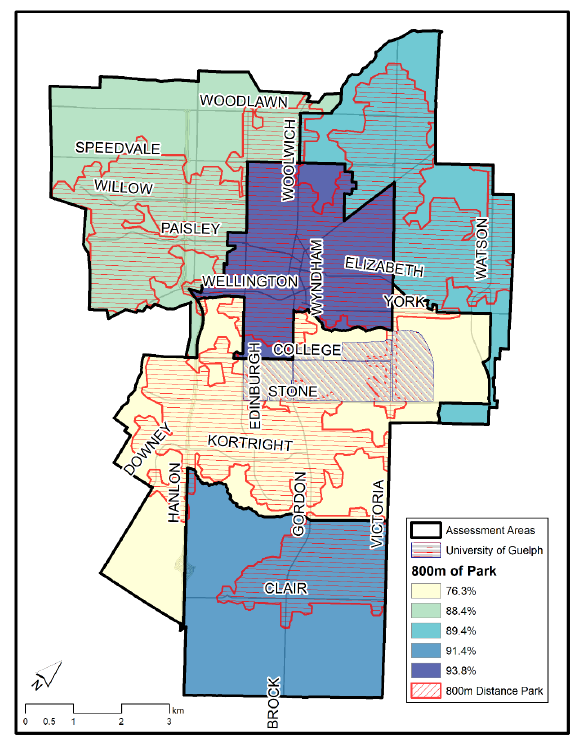
Figure 7. Map of proportion of dwellings within each Guelph study area that were within 800m (approx. 10 min. walk) distance to a bus stop.
Shelburne
Neighbourhoods that are well connected and designed with a mix of land uses including residential, commercial, and recreational development can make amenities and day-to-day tasks more convenient for residents of all ages and abilities.4 Mixed-use land design also encourages active travel (e.g. walking, biking, rolling) to destinations and can result in environmental and economic benefits for the community.4
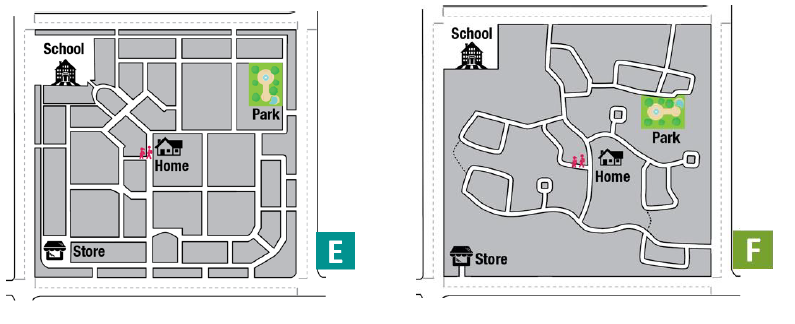
The NDS in Shelburne found that 91% of Shelburne residents preferred a mixed-use neighbourhood design like “image C” depicted in Figure 8 and the majority (63%) of residents also preferred a more connected neighbourhood design like “image E” shown in Figure 9.
One recommendation resulting from these findings was to expand the Shelburne project to include the collection of physical form data indicators as was done in the other communities. Physical form indicators would complement the NDS results and help create a complete understanding of actual neighbourhood design in Shelburne.
Figure 8. NDS imagery questions about preferred mixed-use neighbourhood designs.
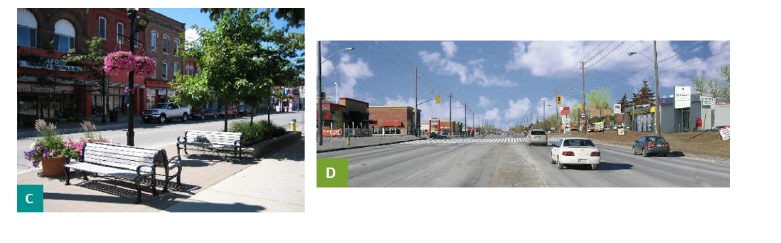
Figure 9. NDS imagery questions about preferred connectivity neighbourhood designs.
Conclusion
The Baseline Project provided four (4) local communities with a baseline understanding of their built environments. Collecting resident opinions and preferences for healthy community design features as well as measuring the physical aspects of the environment, helped identify strengths in each community’s design as well as elements that could be improved or enhanced. The findings will be used to inform municipal policy documents (i.e. official plans, master plans, strategic plans, community plans etc.), advise municipal leaders, and support healthy built environment initiatives within local communities. The creation of baseline measures allows for ongoing monitoring of the HCD indicators over time and evaluation of any interventions or action towards improving these features.
Ontario Public- Health Standard
Foundational Standards
Health Equity
Goal: Public health practice results in decreased health inequities such that everyone has equal opportunities for optimal health and can attain their full health potential without disadvantage due to social position or other socially determined circumstances.
Program Standards
Chronic Disease Prevention and Well-Being
Goal: To reduce the burden of chronic diseases of public health importance and improve well-being.
Requirement:
- The board of health shall develop and implement a program of public health interventions using a comprehensive health promotion approach that addresses chronic diseases risk and protective factors to reduce the burden of illness from chronic diseases in the health unit population.
- The program of public health interventions shall be informed by:
- Consultation and collaboration with local stakeholders in the health, education, municipal, non-governmental, and other relevant sectors.
- Consideration of the following topics based on an assessment of local needs:
- Built environment
- The program of public health interventions shall be informed by:
Healthy Environments
Goal: To reduce exposure to health hazards and promote the development of healthy built and natural environments that support health and mitigate existing and emerging risks, including the impacts of a changing climate.
Requirements:
- The board of health shall identify risk factors and priority health needs in the built and natural environments.
- The board of health shall engage in community and multi-sectoral collaboration with municipal and other relevant partners to promote healthy built and natural environments.
- The board of health shall collaborate with community partners to develop effective strategies to reduce exposure to health hazards and promote healthy built and natural environments in accordance with the Health Hazard Response Protocol, 2018 (or as current) and the Healthy Environments and Climate Change Guideline, 2018 (or as current).
- The board of health shall implement a program of public health interventions to reduce exposure to health hazards and promote healthy built and natural environments.
- The board of health shall, as part of its strategy to reduce exposure to health hazards and promote healthy natural and built environments, effectively communicate with the public by:
- Adapting and/or supplementing national/provincial health communications strategies where local assessment has identified a need;
- Developing and implementing regional/local communications strategies where local assessment has identified a need; and
- Addressing the following topics based on assessment of local needs:
- Built and natural environments
- Climate change
- Exposure to hazardous environmental contaminants and biological agents
- Exposure to radiation, including UV light and radon
- Extreme weather
- Indoor air pollutants
- Outdoor air pollutants
- Other emerging environmental exposures
WDGPH Strategic Direction(s)
✓ Health Equity: We will provide programs and services that integrate health equity principles to reduce or eliminate health differences between population groups.
✓ Organizational Capacity: We will improve our capacity to effectively deliver public health programs and services.
✓ Service Centred Approach: We are committed to providing excellent service to anyone interacting with WDG Public Health.
✓ Building Healthy Communities: We will work with communities to support the health and well-being of everyone.
Health Equity
The burden of illness and disease is not distributed equally across the population. Individuals of lower social and economic status tend to experience poorer health outcomes.1 Furthermore, residents of lower income neighbourhoods are often exposed to more environmental pollution, poor housing, unsafe streets, few parks or greenspaces, poor access to nutritious food, and experience barriers to physical activity.1
Built environment work can help reduce health inequities within a community. Mapping and resident engagement can be effective ways to identify vulnerable areas, and can be used to advocate for policies and interventions that reduce health inequities. For example, ensuring access to safe, active transportation networks in low socioeconomic neighbourhoods, improving parks and green space, reducing environmental hazards, and maximizing food access and affordability, are just some of the ways healthy community design can be used to override socioeconomic differences and enable all people to reach their optimal health.5
References
- Provincial Health Services Authority. Foundations for a healthier built environment summary paper. Vancouver, BC: Provincial Health Services Authority; 2009. Available from http://www.bccdc.ca/pop-public-health/Documents/foundations-summary.pdf
- Atlanta Regional Health Forum, Atlanta Regional Commission. Land use planning for public health: the role of local boards of health in community design and development. [Internet]. 2006 [cited 2019 Feb 1]. Ohio: National Association of Local Boards of Health. Available from: https://www.cdc.gov/healthyplaces/publications/landusenalboh.pdf
- Perdue WC, Stone LA, Gostin LO. The built environment and its relationship to the public’s health: the legal framework. Am J Public Health [Internet]. 2003 [cited 2019 Feb 19]; 93(9):1390-1394. Available from: https://www.ncbi.nlm.nih.gov/pmc/articles/PMC1447979/
- BC Centre for Disease Control. Healthy built environment linkages toolkit: making the links between design, planning and health, Version 2.0. Vancouver, BC: Provincial Health Services Authority, Population and Public Health; 2018. Available from http://www.bccdc.ca/pop-public-health/Documents/HBE_linkages_toolkit_2018.pdf
- BC Centre for Disease Control. Fact sheet: supporting health equity through the built environment. Vancouver, BC: BC Centre for Disease Control; 2017.
Appendices
- None