Meeting date: October 3, 2018
Prepared by: Patty Montague, Health Promotion Specialist, Health Analytics and Health Protection; Lise Trotz-Williams, Epidemiologist, Health Analytics; Shawn Zentner, Manager, Health Protection
Report no.: BH.01.OCT0318.R28
Approved by: Christopher Beveridge, Director, Health Protection
Submitted by: Dr. Nicola J. Mercer, MD, MBA, MPH, FRCPC, Medical Officer of Health and CEO
Recommendations
It is recommended that the Board of Health:
- Receive this report for information.
Key Points
The Well Water Survey was launched May 1, 2018 and is ongoing.
- Only 12.0% of 524 respondents indicated testing their well water three or more times per year.
- 68.7% of respondents reported not testing their well water at least once every year and, of those, more than half (55.0%) said that they intended to test more often, but forget.
- Over 75% of 524 survey respondents expressed some interest (Yes or Maybe) in an email reminder to test their well water.
Discussion
Overview
The purpose of this report is to provide an update on the ongoing Well Water Research Project being conducted by Wellington-Dufferin-Guelph Public Health (WDGPH) on data for private drinking water wells located in Wellington-Dufferin-Guelph (WDG). Information on this project was previously provided in Board of Health 2017 reports numbers BH.01.APR0517.R09 and BH.01.NOV0117.R25. 1, 2
Background
WDGPH is mandated by the Safe Water Standard of the Ontario Public Health Standards to prevent or reduce the burden of waterborne illnesses related to drinking water. Specifically, WDGPH is to conduct surveillance of drinking water sources and systems, carry out epidemiological analysis of surveillance data and use the information obtained to inform safe water programs.
The Well Water Research Project described in this report and in the two previous reports listed above (BH.01.APR0517.R09 and BH.01.NOV0117.R25) explored existing private well water test results for geographical and temporal patterns and trends in sampling frequency of private wells and in adverse water quality results across the region. This work found that:
- Only 44.2% of wells in WDG were tested at least once between 2011 and 2015.
- Annual sampling rates were lower, with an average of 14.7% of wells in WDG sampled each year.
- Bacterial contamination was detected in 19% of samples submitted in WDG. Nearly 3% contained evidence of E.coli bacteria.
- Descriptive spatial analyses detected 13 geographic areas that had an increased risk of bacterial contamination, four of which are detailed in report BH.01.NOV0117.R25.
A further objective of this ongoing project was to collect private well information from owners on well characteristics and their attitudes to and frequency of well water quality testing. This information should aid in the identification of factors influencing well water testing frequency and identify the risk of adverse water quality testing results in WDG.
Goals and Objectives
Project Goal
To reduce the burden of enteric illness related to drinking water in WDG.
Objectives
- To understand trends in well water sampling frequency and adverse results in WDG;
- To increase the number of private domestic wells that are regularly tested for bacteriological contamination; and
- To identify, and raise awareness among owners of private wells, of environmental risk factors that may increase the potential for contamination of wells.
Methods
The data sources used for this project to date include:
- A. Records of well water bacteriological test results provided to WDGPH and owners of private wells in WDG by Public Health Ontario (PHO), for well water samples submitted from 2011-2017.
- B. Registry data of private wells in WDG extracted from the Well Water Information System (WWIS), Ministry of the Environment Conservation and Parks (MECP), used to provide estimates of the number of existing wells in WDG for some analyses where the use of denominator was necessary.
- C. Survey data on well characteristics and well owner awareness, attitudes and testing practices collected by WDGPH over the spring and summer of 2018: In May, 2018, WDGPH launched a survey of residents in WDG serviced by residential wells, to i) identify risk factors associated with adverse private well water quality, and ii) explore reasons for well-owners’ beliefs and attitudes regarding water testing and testing frequency and identify reasons for sub-optimal testing of privately-owned wells within WDG.
To build on previous analyses carried out as described in BOH reports BH.01.APR0517.R09 and BH.01.NOV0117.R25, the following data analyses were done:
Using the statistical software SatScan 9.4.1, the well water test result dataset (A), along with the WWIS estimates of numbers of existing wells per region of WDG, from data set (B), was used to conduct further spatial analyses to detect areas within WDG where the proportion of wells with adverse bacteriological water quality, as well as areas where the Well Water Research Project Update BH.01.OCT0318.R28 Page 4 of 19
proportion of existing wells tested less frequently than considered optimal, was significantly higher or lower than in the rest of WDG. For this study, sub-optimal testing frequency was defined as fewer than three times per year, in accordance with former provincial guidelines. A different approach to analysis, controlling for the number of tested and existing wells in each municipality of WDG, respectively, was used from that applied in previous spatial analyses.
Survey data used in this study were obtained from the survey launched on the WDGPH website in early May 2018. Survey responses, submitted as of the end of July 2018, were linked by street address with historical (2013-2017) water quality test results for the previous five years for corresponding addresses, where possible. The resulting combined dataset was used to conduct preliminary exploratory analyses in the statistical software Stata 12.0 (College Station, Texas) in order to identify well water characteristics associated with an increased risk of adverse test results. In addition, the data were used to examine attitudes, practices and awareness of owners with respect to well water testing, and to identify factors associated with sub-optimal testing frequency of private wells as indicated by the linked historical test results.
Results
Spatial Analysis: Areas with higher occurrence of adverse water quality results
Spatial analyses of the well water testing data for water samples submitted from 2011-2015, inclusive, controlling for the number of wells tested per municipality, revealed a large area where the proportion of wells per municipality with at least one adverse test result was significantly higher than in the rest of WDG. The location of this cluster was approximately the same as that of the largest cluster detected in previous analysis described in BOH report BH.01.NOV0117.R25 (see red circle in Figure 1). Results also showed an area of WDG where the proportion of wells with at least one adverse result was significantly lower than in the rest of WDG (Figure 1).
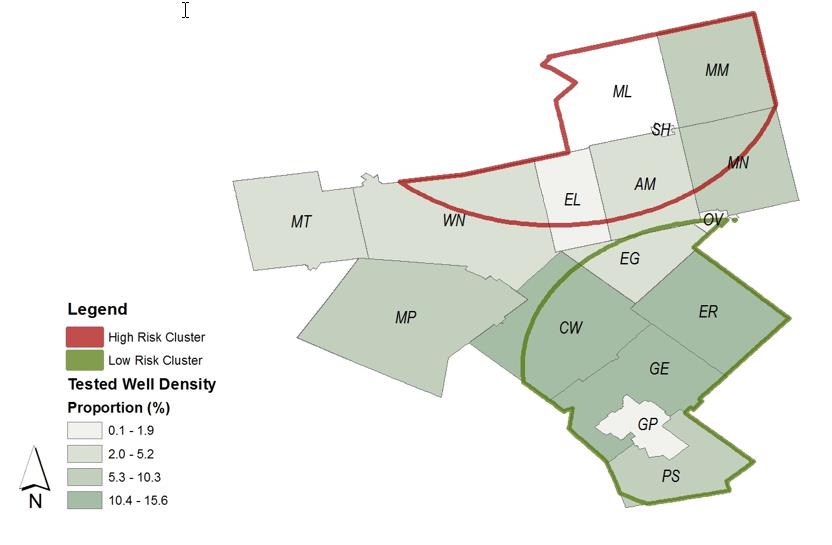
Figure 1. Results of spatial scan using a Poisson model (with PHO denominator of all tested wells) identifying clusters with high (red-outlined area) or low (green-outlined area) rates of wells testing positive for presence of coliform or E. coli at least once from 2011-2015 Note that for each municipality, the shading in the underlying choropleth map shows the percentage of all existing wells in WDG that are located in that municipality, and not the percentage of wells with positive (adverse) test results.
Spatial Analysis: Areas with higher occurrence of sub-optimal testing frequency
Spatial analyses of the well water testing data for water samples submitted from 2011-2015, inclusive, controlling for the number of existing wells tested per municipality derived from the WWIS (Ontario MECP), revealed a large area in north-central WDG where the proportion of all existing wells tested at least three times per year in at least one year from 2011 to 2015 was significantly higher than in the rest of WDG (see green circle in Figure 2). Results also showed a smaller area of WDG, centred around the City of Guelph, where the proportion of wells meeting the former provincial guidelines was significantly lower than in the rest of WDG (red circle in Figure 2).
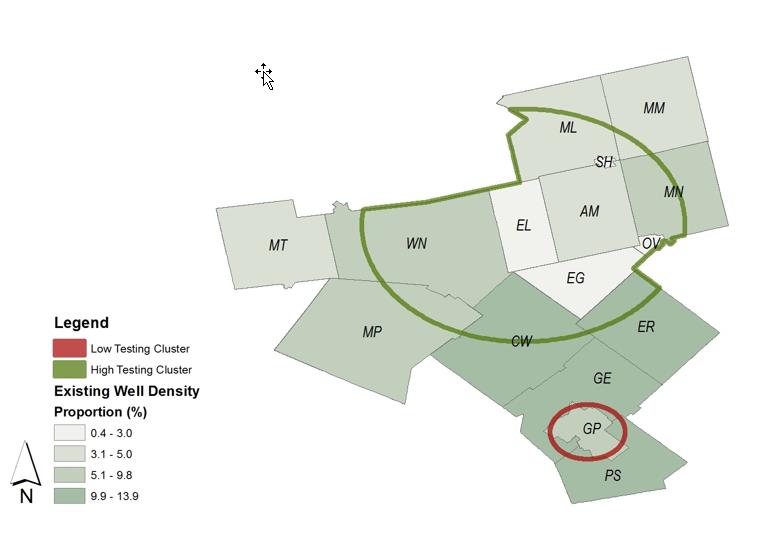
Figure 2. Results of spatial scan using a Bernoulli model (with MOE denominator of all existing wells) identifying clusters with a high (green-outlined area) or low (red-outlined area) proportion of wells that met former PHO guidelines (3+ tests per year) at least once from 2011-2015. Note that for each municipality, the shading in the underlying choropleth map shows the percentage of all existing wells in WDG that are located in that municipality, and not the percentage of wells with positive (adverse) test results.
Survey Results
Frequency distributions of the responses for selected questions, from 524 surveys collected from May through July, 2018, are presented in Appendix A. A copy of the Well Water Survey is available in Appendix B. As the Well Water Survey is ongoing, and data are still being collected, these results should be considered preliminary and subject to change.
Of the surveys submitted, 318 (60.7%) were submitted online and 206 (39.3%) were paper surveys submitted by mail. Responses indicated that the most frequent way in which respondents had heard about the survey was at one of the water sample bottle pickup locations (34.5%), followed by having received a survey in the mail (28.1%). Newspaper ads (16.0%) and WDGPH social media (15.5%) were about equal in reach. At this point, the relatively low percentages of respondents who reported that they had heard about the survey through schools (1.5%) and community events (1.0%) reflect that these methods have yet to be completely rolled out.
In the majority of surveys submitted, respondents were homeowners (96.8%) and intended to submit a water sample around the same time as completing the survey (Yes (52.3%) or Maybe (17.8%); combined = 70.1%). When asked for how long they had owned or lived on the property, 56.5% of respondents reported having lived there for 10 or more years, while 14.3% reported having lived there for 6-10 years, 23.5% for 1-5 years, and 5.7% for less than one year. The majority of respondents reported that their well water was used for drinking (93.1%).
Only 12.0% of respondents reported testing their well water at least three times per year. Another 19.3% reported testing one-two times per year. More than two thirds of respondents reported testing their well water less frequently, with 47.5% reporting testing less than once per year, 16.8% reporting that they had never tested their water, and 4.4% being unsure how often the water is tested.
Of the 360 (68.7%) respondents who reported not testing their well water at least once every year, more than half reported their reason for not testing as that they intended to test more often, but that they forget to do so (55.0%). Thirty percent reported being not concerned about the safety of drinking from the well (30.0%). Inconvenient sample bottle pick-up and drop-off locations were reported as a reason by 19.4% of respondents and inconvenient hours for bottle pick-up and drop-off were reported by 15.6%. Just over 14% reported they did not test at least once every year because they had a treatment system on the well water.
Most respondents indicated some interest in an email reminder service to remind them three times a year to test their water (Yes (61.0%) or Maybe (15.4%); combined = 76.4%).
Factors associated with adverse water quality results
Analysis of a combined dataset comprising a subset of 524 survey responses submitted as of the end of July, and well water test results for those wells for which water quality Well Water Research Project Update BH.01.OCT0318.R28 Page 8 of 19
test results were available for the previous five years (2013-2017; n=277), allowed the investigation of the following variables for statistical associations with the risk of at least one adverse test result over those five years:
- Time of property ownership
- Whether well water was used for drinking
- Presence/absence of treatment system
- Frequency of testing
- Several well characteristics
Results showed that wells were significantly less likely to have had at least one adverse result between 2013-2017 if:
- Water from the well was being used for drinking: the odds of the occurrence of an adverse test result from a well from which the water was being used for drinking was one-third the odds of an adverse test result from a well from which the water was not being consumed (OR 0.33; p=0.02)
- The well was fitted with a tight-fitting cap vs. an easily-removed cap: the odds of the occurrence of an adverse test result from a well with a tight-fitting cap was one-quarter the odds of an adverse test result from a well with an easily removed cap (OR 0.26; p=0.07)
The finding concerning the well cap supported the findings of previously published studies.3, 4 However, results also showed that wells were significantly (and three times) more likely to have had tested positive for bacterial contamination at least once from 2013-2017 if well owners reported in the survey that they had the well tested at least three times a year vs. only one-two times per year (OR 3.1; p=0.003). The more frequently a well is tested, the higher the probability of detection of bacterial contamination that may be present at any particular point in time. It is also possible that this finding could be related to the fact that owners whose wells have produced recent adverse water quality test results are more motivated to test often than are owners whose wells have not produced adverse results and are therefore assumed to be safe. Further, WDGPH encourages and advises owners whose wells have had an adverse test results to retest once remedial steps have been taken.
Besides use of the water for drinking and presence of a tight-fitting cap, none of the variables tested showed a statistically significant association with the risk of an adverse test result. Well Water Research Project Update BH.01.OCT0318.R28 Page 9 of 19
The results reported in this section should be considered preliminary and subject to change as further survey responses are submitted and additional analyses performed.
Factors associated with sub-optimal sampling frequency
The following variables from the survey were examined for statistically significant associations with frequency of testing as reflected by the PHO test submission data (i.e., whether or not the test data showed that a well had been tested at least three times per year in at least one of the previous five years [2013-2017]):
- Length of time of property ownership
- Whether well water was used for drinking
- Presence/absence of treatment system
Results of this analysis showed that well owners were less likely to have met previous guidelines in at least one year between 2013-2017 if water from the well was used for drinking, with the odds of an owner having met the previous guidelines being approximately halved if that owner reported that water from the well was being used for drinking, when compared to wells from which the water was not being consumed (OR = 0.45 for water used, p=0.09). A possible explanation of this finding is that wells used for drinking are being better maintained and are therefore less likely to produce an adverse test result, thus reducing the motivation of well owners to test in such a scenario. However, a definitive explanation of this result would require further investigation.
Neither length of time for which property had been owned by the respondent, nor whether or not a treatment system was present, showed a statistically significant association with testing of wells in accordance to former guidelines.
The results reported in this section should be considered preliminary and subject to change as further survey responses are submitted and additional analyses performed.
Conclusions
Results of spatial analyses of the test data support previous findings reported in BH.01.NOV0117.R25, with a significantly higher proportion of wells being tested according to former guidelines, and also a higher risk of adverse well water quality, in the northern, more rural area of WDG. As mentioned, one possible explanation for this finding is the recommended practice of re-testing after an adverse test result. It is also possible that the test result database includes data from water sample submissions from farms, which would be reflected in the database by large numbers of tests, and probably a higher percentage of adverse results, for those locations. Well Water Research Project Update BH.01.OCT0318.R28 Page 10 of 19
Only 12.0% of survey respondents reported testing their well water three or more times per year, and, of those who don’t test at least once every year, the most often reported reason for not testing is that they forget to do so (55.0%). In this context, it is encouraging, and an opportunity for WDGPH, that over 75% of survey respondents expressed some interest (Yes or Maybe) in an email reminder to test their well water.
Analysis of the linked survey and test data indicated that wells with at least one adverse result were generally tested significantly more often than wells with no adverse result. This could reflect the higher probability of detection of contamination that would naturally result from more frequent testing, but could also indicate that owners become complacent if there are no adverse results, and that wells with no previous or recent adverse results are generally tested only rarely. The very low percentage of survey respondents who reported that they test according to the former guidelines appears to support this finding, and also to justify WDGPH efforts to raise awareness of the importance of testing regardless of previous results.
The preliminary analysis of the linked survey and test data gave results that appear to support previously published findings regarding risk factors for adverse results. Further analyses of the linked data will attempt to investigate this further, and results may be communicated to owners to encourage better well maintenance.
Next Steps
Future directions of this project will include:
- Continuation of cleaning and geocoding of the PHO Lab data of water sample results, to ensure the addresses are complete and correct, with the ultimate goal of maintaining a complete and clean water sample dataset containing water quality test records from 2006 through the present day;
- Continued promotion of the Well Water Survey and expanded reach of potential respondents through school and community events;
- Linking of the additional survey data submitted to date (since end of July 2018) with PHO Lab results for corresponding wells; and
- Additional analyses when data collection is complete.
Ontario Public Health Standard
Safe Water program standard
WDGPH Strategic Direction(s)
✓ Health Equity: We will provide programs and services that integrate health equity principles to reduce or eliminate health differences between population groups.
✓ Organizational Capacity: We will improve our capacity to effectively deliver public health programs and services.
✓ Service Centred Approach: We are committed to providing excellent service to anyone interacting with WDG Public Health.
✓ Building Healthy Communities: We will work with communities to support the health and well-being of everyone.
Health Equity
WDGPH will use the results of this research to inform interventions that reduce disparities in well water testing and promote safe drinking water for all residents. Identifying barriers to sampling in areas with low sampling rates will allow WDGPH to implement evidence informed interventions across WDG. Health equity considerations will also be included in every step of intervention planning and implementation.
References
- Wellington-Dufferin-Guelph Public Health. HBOH report - BH.01.APR0517.R09 Well Water Health Analytics [Internet]. 2017 April 5. [cited 2018 Sept 13] Available from: https://www.wdgpublichealth.ca/sites/default/files/bh.01.apr0517.r09_-_well_water_health_analytics_access.pdf.
- Wellington-Dufferin-Guelph Public Health. HBOH report - BH.01.NOV0117.R25 Well Water Research Project [Internet]. 2017 November 1. [cited 2018 Sept 13] Available from: https://www.wdgpublichealth.ca/sites/default/files/bh.01.nov0117.r25_-_well_water_research_project_access.pdf.
- Swistock BR, Clemens S, Rummel S. Water quality and management of private drinking water wells in Pennsylvania. J Environ Health. 2012;75(6):60-66
- Zimmerman TM, Zimmerman ML, Lindsey BD. Relation between well-construction practices and occurrence of bacteria in private household-supply wells, south-central and southeastern Pennsylvania, U.S. Geol. Surv. Water Resour. Invest. Rep., 01-4206. 2001
Appendices
Appendix A – Frequency distributions of the responses for selected questions from 524 surveys collected from May-July, 2018
Appendix B – Well Water Survey – Final Version
Apendix A
Frequency distributions of responses for selected questions from 524 surveys collected from May-July, 2018
| Selected Questions from the Survey | Response option | Total number (%) |
|---|---|---|
| Surveys submitted | Online | 318 (60.7) |
| Paper | 306 (39.3) | |
| How did you hear abou the survey? | Newspaper ad | 84 (16.0) |
| Public Health website, Twitter, Facebook | 81 (15.5) | |
| Recieved survey in mail | 147 (28.1) | |
| Received survey through school | 8 (1.5) | |
| Community event | 5 (1.0) | |
| Pickup location* | 181 (34.5) | |
| Other | 42 (8.0) | |
| Homeowner Status | Owner | 507 (96.8) |
| Tenant | 17 (3.2) | |
| Plan to submit water sample around same time as completing the survey? | Maybe | 93 (17.8) |
| No | 157 (30.0) | |
| Yes | 274 (52.3) | |
| Number of years owned/lived at property | <1 year | 30 (5.7) |
| 1-5 years | 123 (23.5) | |
| 6-10 years | 75 (14.3) | |
| 10+ years | 296 (56.5) | |
| Is the well water used for drinking? | No | 36 (6.9) |
| Yes | 488 (93.1) | |
| If the well water is not used for drinking, why not?** | Don’t like taste/odour/appearance | 23 (63.9) |
| Concerned about safety | 22 (61.1) | |
| How ofen do you test the well water? | I have never tested my well water | 88 (16.8) |
| Less than once per year | 249 (47.5) | |
| 1-2 times per year | 101 (19.3) | |
| At least three times a year | 63 (12.0) | |
| Unsure | 23 (4.4) | |
| If the water is not tested at least once every year, why not? | Not concered about safety | 108 (30.0) |
| Well water is not used for drinking | 10 (2.8) | |
| There is a treatment system on the well water | 51 (14.2) | |
| Locations for pick-up/drop-off not convenient | 70 (19.4) | |
| Hours for pick-up/drop-off not convenient | 56 (15.6) | |
| I intend to test more often, but I forget to do so | 198 (55.0) | |
| The well water is tested regularly (every year) | 12 (3.3) | |
| Would you like an email reminder to test your well water? | Maybe | 80 (15.4) |
| No | 123 (23.6) | |
| Yes | 318 (61.0) |
*Pick-up locations included WDGPH offices, municipal offices, libraries, hospitals
** Repsondents could select more than one response and, so, percentages may sum to more than 100%
Appendix B
Well Water Survey - Final Version
Thank you for your interest in the well water survey. Please read the enclosed invitation letter before beginning the survey.
To complete the survey online visit: wdgpublichealth.ca/WWS. At the end of the online survey, you will have the option of clicking on a link to enter the monthly draw for a $50 grocery gift card for President’s Choice Stores (includes Zehrs, No Frills, and Loblaws).
To return a paper copy of the survey, drop it off at any of our water sampling bottle drop off locations listed here: wdgpublichealth.ca/wellwater. To enter the monthly draw for a $50 grocery gift card for President’s Choice Stores (includes Zehrs, No Frills, and Loblaws) follow the instructions provided in the enclosed paper ballot.
IMPORTANT: By returning this survey, you agree to participate and confirm you have read and understand the information provided in the invitation letter. Note that the invitation letter indicates that direct quotes will be used only if they do not identify you.
To participate in this survey, you must:
- own or live on a property that is serviced by a private drinking water well (located in the County of Wellington, the County of Dufferin or the City of Guelph), and
- be willing to provide your address, and
- be 18 years of age or older.
Consequently, questions 1-3 must be answered if you wish to participate in the survey.
1. Address of the property where your private well is located:
Street Address: ___________________________________________________
Municipality: ______________________________________
County (if applicable): ______________________________
Postal Code: __________________
2. Are you one of the following? (choose one)
- Homeowner living on the property with a well
- Owner/landlord of the property with a well
- Tenant living on the property with a well
- Owner of a recreational property/cottage serviced by a well
- Other: _____________________________________________
- I do not own or live on a property that is serviced by a well
3. Are you 18 years of age or older?
- Yes
- No
The information in this survey is collected under the authority of the Health Protection and Promotion Act in accordance with the Municipal Freedom of Information and Protection of Privacy Act. This information will be used for the delivery of public health programs and services; and the maintenance of databases; registries and related research, in compliance with legal and regulatory requirements. Any questions about the collection of this information should be addressed to Manager, Environmental Health, Shawn.Zentner@wdgpublichealth.ca or call 1-800-265-7293 ext. 4230.
You can choose to answer all or some of the remaining questions.
4. Are you submitting a well water sample for testing around the same time you are completing this survey?
- Yes
- No
- Maybe
5. Please enter the date you are completing this survey (dd/mm/yyyy): ________________
6. How many years have you owned/lived at this property? Under 1 year
- 1-5 years
- 6-10 years
- 10+ years
7. Is the well water used for drinking?
- Yes
- No
8. If the well water is not used for drinking, why not? (Select all that apply)
- Don’t like taste/odour/appearance
- Concern about safety of well water
- Other (please specify): _________________________________
9. Do you have any of the following treatment systems on the well water? (Select all that apply)
- UV treatment
- Reverse Osmosis (RO)
- Chlorine injection system
- Unsure
- Do not use any treatment
- Other (please specify): _________________________________
10. How often do you test the well water?
- I have never tested my well water before
- Less than once per year
- 1-2 times a year
- At least three times a year
- Unsure
11. What are your primary reasons for testing the well water? (Select all that apply)
- Want to ensure water is safe to drink
- Previous bad result
- Habit/Routine
- Received/saw a public reminder (e.g. newspaper article, social media message)
- Legal/real estate reasons
- The well water is not tested
- Other (please specify):____________________________________________
12. If the well water is not tested at least once every year, why not? (Select all that apply)
- Not concerned about the safety of drinking the well water
- Well water is not used for drinking
- There is a treatment system on the well water
- The locations of the water bottle pick-up and drop-off are not convenient
- The hours for water bottle pick-up and drop-off are not convenient
- I intend to test more often, but I forget to do so
- The well water is tested regularly (every year)
- Other (please specify): ____________________________________________
13. How would you prefer to receive educational information about well water testing? (This would not include your well water testing results) (choose your top 1-2 choices)
- Paper brochures available at water bottle pick up locations
- Newspaper
- Public Health’s webpage
- Facebook/Twitter
- Other (please specify):____________________________________________
- Would prefer not to receive information
14. Would you sign up for an email reminder service that sends you an email three times a year to remind you to test your well water? (You would only need to provide your email address and you could unsubscribe from this service at any time.)
- Yes
- No
- Maybe
15. Approximately how old is the well?
- Under 1 year
- 1 – 10 years
- 11 – 35 years
- 36 – 75 years
- More than 75 years
- Unsure
16. What kind of well is it?
- Dug well - large diameter cement casing, 24-48 inches (60-120 cm)
- Drilled well - small diameter casing, 4-8 inches (10-20 cm)
- Other (please specify): ___________________________________
- Unsure
17. What is the depth of the well?
- Less than 30 feet (less than 9 metres)
- Between 30 to 100 feet (9-30 metres)
- Greater than 100 feet (greater than 30 metres)
- Unsure
18. Relative to ground level, where is the top of the well?
- Below ground level in an access pit
- Below ground level/buried and non-accessible
- At approximately ground level
- Less than 16 inches (40 cm) above ground
- 16 inches (40 cm) or greater above ground
- Unsure
19. What kind of cap covers the top of the well? Tight fitting secure cap (requires a tool to remove)
- Cap that is easily removed
- Sealed or secure cement cover
- Cement cover, unsure if considered sealed
- Wooden or other material cover that is easily removed
- Unsure because it is buried
- Other (please specify):________________________________________
20. Does surface water (for example, rain, snow melt, etc.) drain away from the well?
- Yes, surface water clearly drains away from the well
- No, surface water regularly pools and collects around well
- No, surface water sometimes pools and collects around well
- Unsure
21. Are any of the following located within about 50 feet (15 metres) of the well? (Select all that apply)
- Septic system
- A field or barn with livestock
- A field where manure is sometimes spread
- A manure storage site
- Pond, creek, river or other surface water
- None of the above are within 50 feet (15 metres) of the well
- Unsure
22. How did you hear about this survey? (Select all that apply)
- Newspaper ad
- Public Health’s website, Twitter, Facebook
- Received the survey in the mail
- Received a water bottle and/or survey through a school
- Attended a community event where water bottles and/or surveys were distributed
- Picked up a sampling bottle with a survey attached from a water bottle pick up location (e.g. Public Health office, municipal office, library, hospital)
- Other (please specify): _______________________________________
23. Do you have any additional comments to share about well water quality and testing?
__________________________________________________________